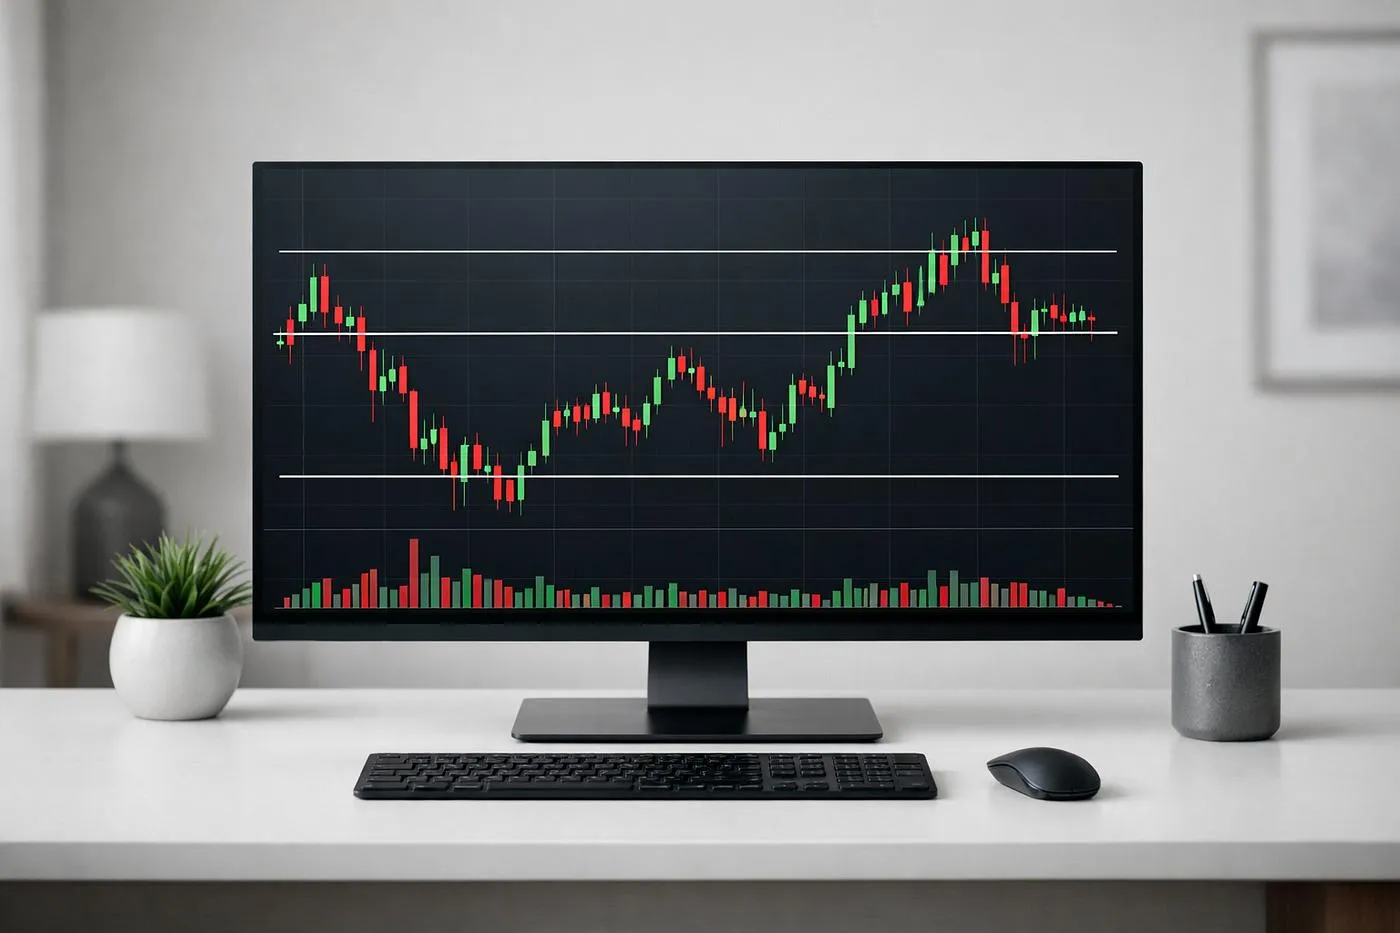
The TSR (Trend Support Resistance) Indicator is one of the easiest tools for finding important support and resistance levels in Nifty and Sensex. It automatically marks key price zones where the market is likely to bounce, reverse, or break out.
Find Indicator >Go to Trading View > Indicators > Search TSR >
Author Name : ismailcarlik
Look The Image For Nifty in Support And Resistance Using TSR Indicator

- It also Works very well in Stocks Too
- FNO Traders Helpful For Month Starting Options For Wait and Book the profits
- Best Works In 15min , Hourly Timeframe
Why Use the TSR Indicator?
- Automatically identifies support and resistance levels.
- Suitable for Nifty and Sensex trading.
- Easy for beginners to understand.
- Works well for intraday and swing trading.
- Helps improve entry and exit timing.
How to Trade
Buy Signal
- Wait for Nifty or Sensex to reach a TSR support level.
- Look for a bullish candlestick confirmation.
- Enter after the confirmation candle closes.
- Place the stop-loss below the support level.
Sell Signal
- Wait for price to reach a TSR resistance level.
- Look for a bearish reversal candle.
- Enter after confirmation.
- Place the stop-loss above the resistance level.
Tips for Better Accuracy
- Trade in the direction of the overall trend.
- Confirm signals with higher trading volume.
- Maintain at least a 1:2 risk-to-reward ratio.
- Avoid trading during major news events.
Conclusion
The TSR Indicator is a simple yet effective tool for identifying strong support and resistance levels in Nifty and Sensex. When combined with price action and proper risk management, it can help traders make more confident trading decisions.