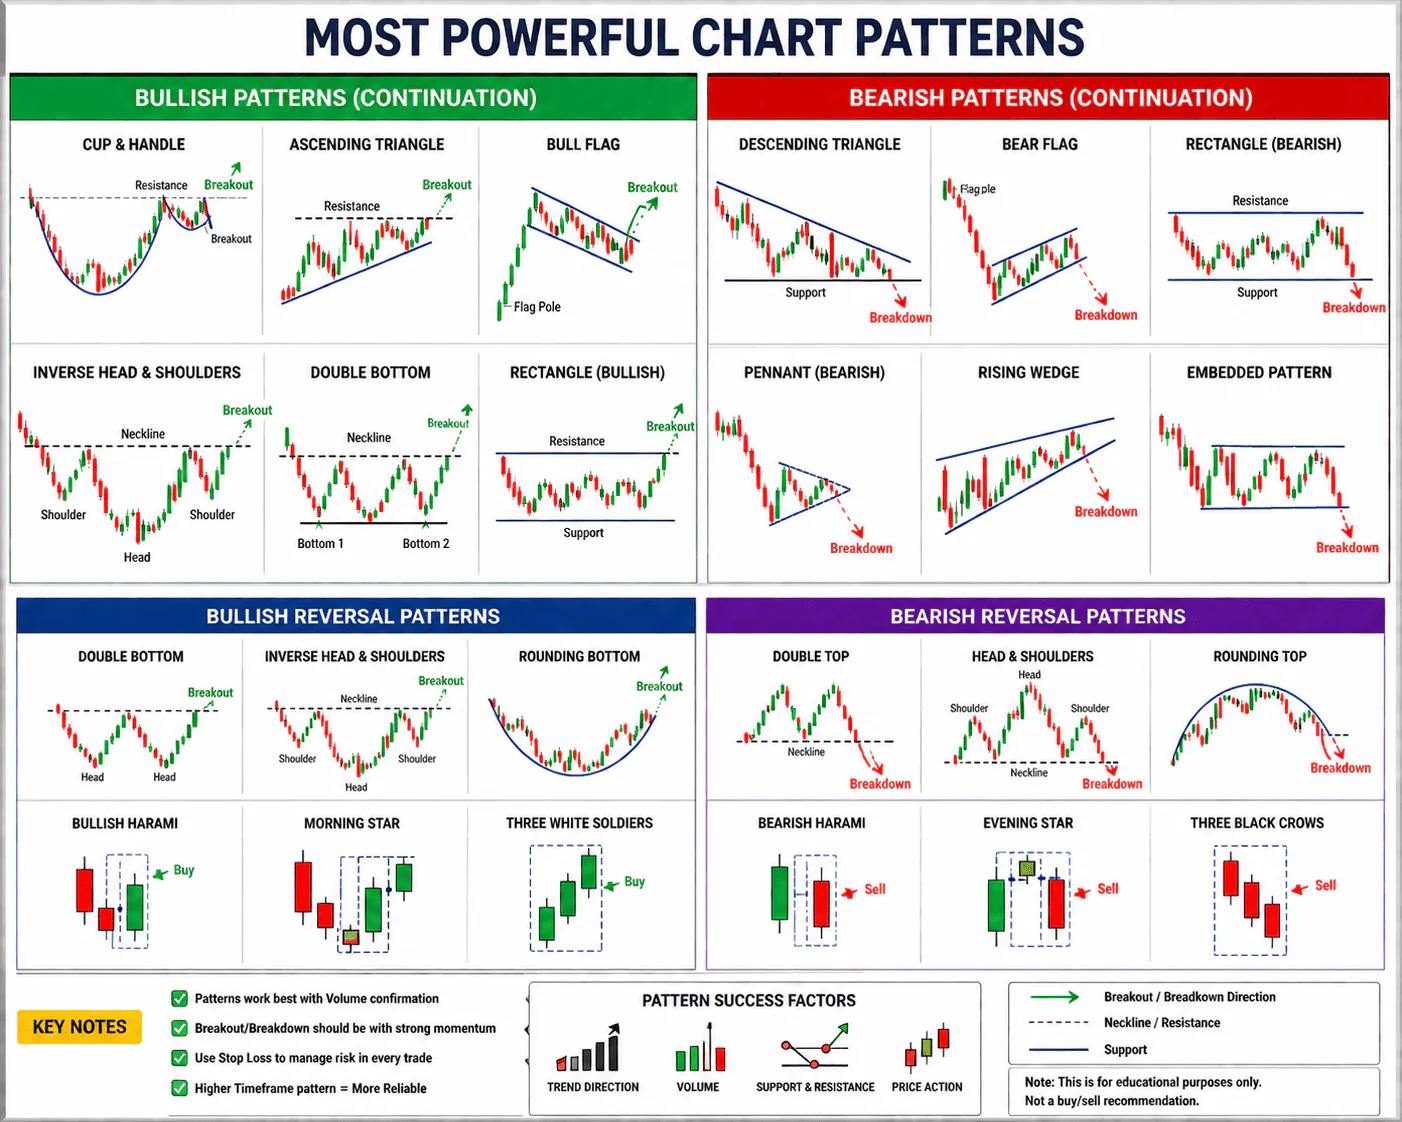
These chart patterns are among the most commonly used by professional traders because they frequently appear in liquid F&O stocks. No pattern guarantees success, so traders typically wait for confirmation through a breakout with higher-than-average volume before entering.
| Rank | Chart Pattern | Accuracy* | Best Trade |
|---|---|---|---|
| 🥇 | Cup & Handle | High | Call Options |
| 🥈 | Ascending Triangle | High | Call Options |
| 🥉 | Bull Flag | High | Call Options |
| 4 | Inverse Head & Shoulders | High | Call Options |
| 5 | Double Bottom | Medium-High | Call Options |
| 6 | Rectangle Breakout | Medium-High | Call/Put (Direction of Breakout) |
| 7 | Descending Triangle | High | Put Options |
| 8 | Bear Flag | High | Put Options |
| 9 | Head & Shoulders | High | Put Options |
| 10 | Double Top | Medium-High | Put Options |
Best Bullish Patterns
1. Cup & Handle ☕
- Strong continuation pattern.
- Usually forms after a long uptrend.
- Buy after breakout above the handle.
- Best for swing trades and option buying.

2. Ascending Triangle 🔺
- Flat resistance with rising support.
- Buyers become increasingly aggressive.
- Entry on breakout with strong volume.

3. Bull Flag 🚩
- Sharp rally followed by a brief consolidation.
- Indicates trend continuation.
- Popular among intraday and swing traders.

4. Inverse Head & Shoulders
- Major trend reversal pattern.
- Breakout above the neckline confirms bullishness.
- Often leads to sustained upside.

5. Double Bottom (W Pattern)
- Strong reversal after a downtrend.
- Entry above the neckline.
- Reliable when supported by rising volume.

Best Bearish Patterns
Head & Shoulders
- Signals a potential reversal from an uptrend.
- Neckline breakdown confirms weakness.
- Often used for buying Put options.


Bear Flag
- Sharp fall followed by a weak upward retracement.
- Breakdown suggests continuation of the downtrend.

Descending Triangle
- Falling resistance with horizontal support.
- Breakdown can trigger strong bearish momentum.

Double Top (M Pattern)
- Indicates buying exhaustion.
- Confirmation comes when support is broken.

Indicators That Improve Success
- Volume should expand on the breakout.
- RSI above 60 (bullish) or below 40 (bearish).
- MACD bullish/bearish crossover.
- Price above the 20 EMA and 50 EMA for bullish setups.
- Breakouts aligned with the broader market trend often have a higher probability of follow-through.